Positive GDP Growth for T&T – But Risks Persist
Vangie Bhagoo-Ramrattan – Head, Economic Research Unit, First Citizens
Commentary
The outlook for economic growth in Trinidad and Tobago (T&T) appears to be improving based on projections by the International Monetary Fund (IMF) which were published in April 2023. This is encouraging for the country, especially as the IMF’s World Economic Outlook (also published in April 2023) highlighted a global economic slowdown in 2023 relative to 2022’s performance and highlighted several risks to the highly uncertain outlook. The forecasts for global growth for the short-term (2023 and 2024) were also cut relative to the Fund’s January 2023 projections. In addition to the IMF’s improved near-term outlook for T&T, the Central Statistical Office (CSO) also recently published GDP data for the third quarter of 2022, which also points to a nascent recovery domestically. The data reveals that there have been positive developments in recent economic activity, specifically as the country continues to rebound in the aftermath of the pandemic. Even so, the longer-term trend remains a critical challenge, particularly relevant in an extremely uncertain external economy.
Elevated External Risks
After expanding by an estimated 3.4% in 2022, world economic growth is projected to slow to 2.8% in 2023 and up moderately to 3% in 2024. The anticipated slowdown is more pronounced in the advanced economies while growth in emerging markets and developing economies is largely supported by a rebound in China. The projections for the advanced economies are significantly lower than 2022’s performance, specifically for the United States (US) and most of the European countries. The IMF expects the US economy to expand by 1.6% in 2023 and the Eurozone by 0.8%. The United Kingdom (UK) is forecasted to contract by 0.3%. The weaker outlook was attributed to the dampening effect of tighter policies to contain inflation, the fallout from the deterioration in recent financial conditions, the ongoing war in Ukraine and growing geoeconomic fragmentation. Looking further ahead to 2028, the IMF forecasts global growth of around 3% which is the lowest medium-term forecast in an IMF World Economic Outlook report since 1990.
While inflation has fallen from peak levels in 2022, underlying inflationary pressures remain relatively sticky and high. Despite retreating commodity prices, specifically food and fuel which has helped to reduce headline inflation, the tight labour market conditions which exist in some countries continue to push wages higher, causing generally inflationary conditions. So far, however, the impact of the labour market tightness seems to be contained as real wage growth in the advanced economies has been lower than at the end of 2021. This prevents a wage-price spiral, where both wages and prices accelerate simultaneously for a sustained period.
Softer Food and Fuel Prices
At its April 2023 meeting, OPEC+ member countries decided to cut output amounting to around 1.16 million barrels aimed at supporting market stability and would last until the end of 2023. This surprise move follows a cut of two million barrels a day in October 2022 and resulted in an initial increase in crude prices by around 5%. Since then, notwithstanding the anticipated cut in world supply, prices have retreated and have largely been affected by the uncertainty about the strength of the global economy and energy demand. Year to date, WTI Crude price is down by just under 5%, while Brent Crude is down by 6.5%. Henry Hub natural gas prices have also seen a sharp decline, down 50% year to date. The softer prices resulted from milder than expected temperatures which weakened heating demand.
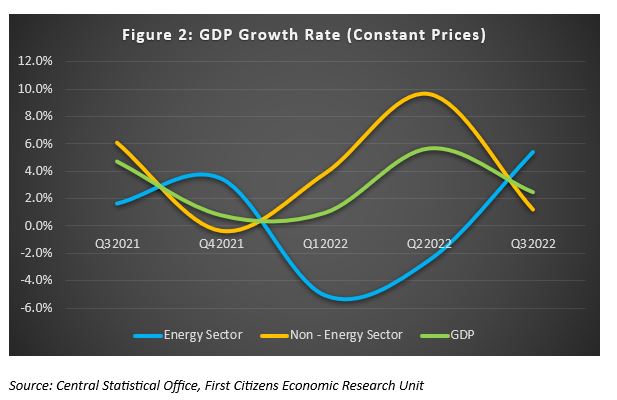
Global food prices, as measured by the United Nations’ FAO Food Index declined for the 12th consecutive month in March 2023. The index was down 2.1% (MoM) and relative to March 2022, food prices have dropped by 20.5% led by price declines in cereal, vegetable oil and dairy. According to the FAO, during the month, sugar and meat prices rose. Figure 1 shows price trends in global food and fuel prices since January 2022. Global food price is measured by the UN’s FAO Index and energy prices are measured by the Bloomberg Energy Subindex, which is composed of futures contracts on crude oil, heating oil, unleaded gasoline and natural gas.
A Closer Look At T&T’s GDP
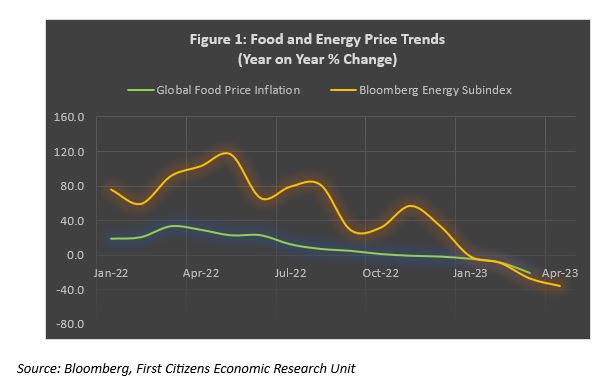
In a release by the Central Statistical Office (CSO), data showed that the T&T economy expanded by 2.5% (YoY) in the third quarter of 2023, with GDP reaching TTD37.7 billion in constant prices. During Q322, the energy sector accounted for 30.5% of GDP and expanded by 6.7% (quarter on quarter) and 5.4% over Q321. All subsectors in the energy sector contributed positively to overall GDP growth, except for crude oil exploration and extraction, which declined marginally. Growth in the manufacture of petrochemicals, while positive on a QoQ basis, posted its third consecutive contraction on a YoY basis during Q322.
Promisingly, the non-energy sector has performed commendably particularly given the deep decline in activity associated with the pandemic-induced restrictions on most of the sector over the 2020-2021 period. Non-energy activity expanded by 1.2% (YoY) and 3.6% (QoQ). The positive performance was driven by strong activity in transport and storage, non-energy manufacturing, construction and trade and repairs. Notably, non-energy manufacturing output rose sharply by 13.4% in Q322, driven by food, beverages, tobacco products and textiles, clothing, leather, wood, paper and printing.
Notwithstanding the encouraging recent uptick in economic activity, there are some structural challenges with which the economy is faced. The size of the T&T economy, as measured by GDP in constant prices has shrunk from TTD42.8 billion at the start of 2012 to TTD37.8 billion in Q322, suggesting that the size of the economy is approximately 12% smaller than it was in 2012.
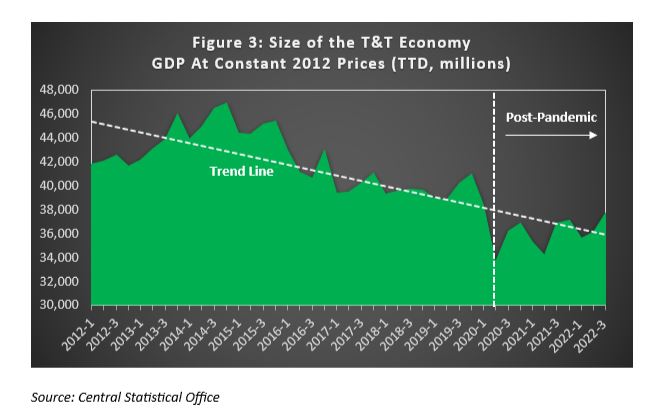
There has been much debate about the diversification of the T&T economy over the years and its dependence on the energy sector. This dependency has left the country extremely susceptible to exogenous shocks, particularly the global energy market, in which T&T is a price-taker. It has facilitated a largely procyclical approach to government spending. The T&T economic cycle therefore is highly contingent on swings in the commodity markets over which we have little or no control. Over the years, this volatile relationship was quite evident and in the 2014-2016 global commodity price shock, which saw one of the largest oil price declines in modern history, the T&T economy never fully recovered as shown in Figure 3. After oil prices collapsed by more than 60% during that period, and GDP peaked at around TTD47 billion, T&T’s GDP consistently declined, and the energy’s share of total GDP fell from around 40% in 2012 to just around 30% in Q322. At the same time, the non-energy share of GDP rose from around 60% to close to 70% of total GDP during the same period. Within the non-energy sector, the three industries that saw increases in contribution to total GDP over the 2012 – Q322 period were manufacture of food, beverages and tobacco products (+2.7%), financial and insurance activities (+2.5%) and public administration (+1.6%). The increase in manufacturing’s share of GDP is a positive development as it has the potential to earn foreign exchange through increased exports. Of note, in 2017 the CSO rebased its annual GDP from a base year of 2000 to 2012[1].
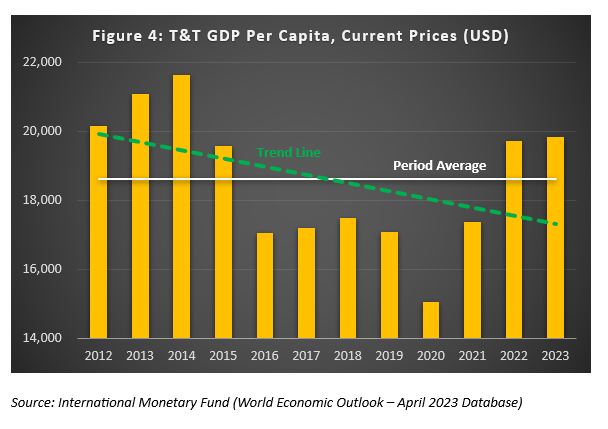
The decline in energy’s share of GDP suggests some level of diversification, but the extended contraction in the size of the T&T economy presents a fundamental challenge which has to be addressed. Once the size of the economy consistently shrinks, it has severe repercussions on a country’s standard of living. In the case of T&T, after peaking in 2014 at just under USD22,000, GDP per capita (current prices) has declined and at the end of 2019 (pre-pandemic), it stood at USD17,097. The IMF estimates that since 2020, when per capita fell to USD15,048, there has been an upward trend, estimated at USD19,718 in 2022, above the 2012 – 2023 average. GDP per capita is defined[2] as the total value at current prices of final goods and services produced within a country during a specified period divided by the average population for the same year, and according to the World Bank sustained economic growth increases average incomes and is strongly linked to poverty reduction. It is considered a good indicator of the standard of living within a country, though with limitations.
Increasing Production Capacity Amid Risks
The production possibility curve represents the output a country can produce with its limited resources. A country that operates within the curve indicates that some resources are not fully employed. Growth cannot be sustained in the long-term unless production capacity increases either through the expansion of resources or improving the use of existing resources. The production potential of a country can be increased through augmenting the factors of production such as increasing the availability of additional resources, such as natural resources discoveries, immigration (which increases the labour) or increases in investment expenditure on the creation of more capital goods. Production capacity can also be augmented through increased use of technology and better training and development of the workforce. These measures can help to shift the production possibility curve outward, which would fuel economic expansion and development.
During the pandemic, many countries globally experienced a sharp contraction in economic activity. Recovery since then has been extremely choppy given the myriad of threats including the Ukraine war, the surge in inflation, which was accompanied by rapidly tightening policy, which has since helped to cool inflation, but at the same time, tempered economic activity.
The heightened external economic risks, including weaker global growth and the softer energy prices will continue to impact the T&T economy. Production in the energy sector remains below historical levels and is weighing on the sector’s performance particularly in the downstream industries – a situation which has limited the extent to which T&T could have capitalized on the commodity price spikes experienced over the past year.
Increasing T&T’s production capacity will require a policy-driven approach. The ‘Vision 2030’ plan which is the government’s comprehensive strategic policy framework has identified key priorities to facilitate medium term inclusive growth, reduce external imbalances and enhance resilience. While it has been a long-standing challenge for T&T, broad structural reforms remain critical to facilitate the expansion of the economy, both non-energy and energy sectors.
DISCLAIMER
First Citizens Bank Limited (hereinafter “the Bank”) has prepared this report which is provided for informational purposes only and without any obligation, whether contractual or otherwise. The content of the report is subject to change without any prior notice. All opinions and estimates in the report constitute the author’s own judgment as at the date of the report. All information contained in the report that has been obtained or arrived at from sources which the Bank believes to be reliable in good faith but the Bank disclaims any warranty, express or implied, as to the accuracy, timeliness, completeness of the information given or the assessments made in the report and opinions expressed in the report may change without notice. The Bank disclaims any and all warranties, express or implied, including without limitation warranties of satisfactory quality and fitness for a particular purpose with respect to the information contained in the report. This report does not constitute nor is it intended as a solicitation, an offer, a recommendation to buy, hold, or sell any securities, products, service, investment or a recommendation to participate in any particular trading scheme discussed herein. The securities discussed in this report may not be suitable to all investors, therefore Investors wishing to purchase any of the securities mentioned should consult an investment adviser. The information in this report is not intended, in part or in whole, as financial advice. The information in this report shall not be used as part of any prospectus, offering memorandum or other disclosure ascribable to any issuer of securities. The use of the information in this report for the purpose of or with the effect of incorporating any such information into any disclosure intended for any investor or potential investor is not authorized.
DISCLOSURE
We, First Citizens Bank Limited hereby state that (1) the views expressed in this Research report reflect our personal view about any or all of the subject securities or issuers referred to in this Research report, (2) we are a beneficial owner of securities of the issuer (3) no part of our compensation was, is or will be directly or indirectly related to the specific recommendations or views expressed in this Research report (4) we have acted as underwriter in the distribution of securities referred to in this Research report in the three years immediately preceding and (5) we do have a direct or indirect financial or other interest in the subject securities or issuers referred to in this Research report.
[1] In 2017 also, the CSO migrated to the International Standard Industrial Classification (ISIC).
[2] As defined by the International Monetary Fund