The Trinidad and Tobago Economy – A 60-year Perspective
Commentary
Trinidad and Tobago celebrated its 60th anniversary of independence on 31 August, 2022. At this juncture, many commentators would have offered their perspectives on the twin-island nation’s progress and pitfalls from a political and social perspective. In this article, we will take a data-driven approach while examining the development of the country’s economy from 1962 to the present.
Economic Growth & Living Standards
Despite its limitations, gross domestic product (GDP) per capita is generally considered by economists to be one of, if not the most useful single indicator of a country’s standard of living. Trinidad and Tobago’s GDP per capita has grown from USD679 in 1962 to USD17,900 in 2021. By this measure, therefore, material living standards in Trinidad and Tobago have grown 25-fold in current-price terms over the post-Independence period. As can be seen from Figure 1 below, however, the country’s economic progression has not always been smooth, and has in fact been punctuated by boom-and bust cycles especially around the oil price shock of 1973 and the longer commodities supercycle from the early 2000s to 2014-15.
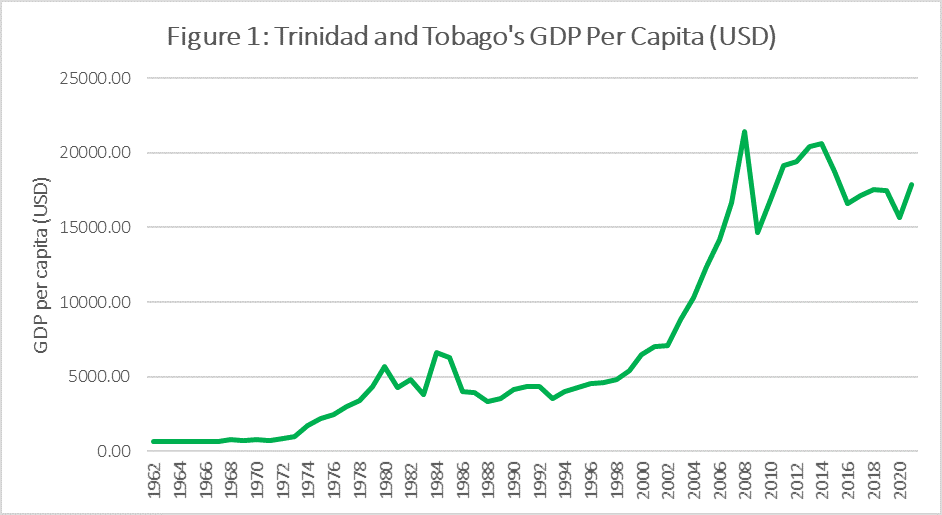
Based on its GDP per capita figures, Trinidad and Tobago was classified as a high-income country by the World Bank in 2011, and was therefore removed from the World Bank’s Development Assistance Committee listing, while the Organization for Economic Co-operation and Development (OECD) removed Trinidad and Tobago from its list of developing countries in the same year. Despite these positive developments, Figure 1 demonstrates that the past 15 years have been subject to significantly increased volatility in the country’s economic fortunes. Per-capita income peaked at over USD21,000 in 2008, collapsed to USD14,694 in 2009, recovered to USD20,624 in 2014 followed by a decline again to USD15,654 during the depths of the COVID-19 pandemic in 2020, and now a recovery to USD17,900 in 2021 on the back of rebounding energy prices.
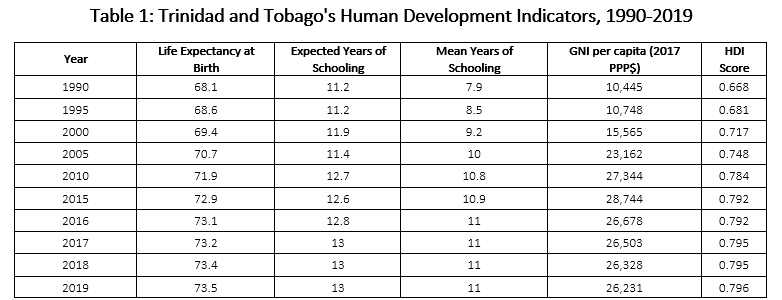
For a more holistic view on living standards in Trinidad and Tobago, the United Nations’ Human Development Index (HDI) can be observed alongside per capita income. The HDI attempts to summarise the overall state of a country’s progress in three key dimensions of human development: health (measured by life expectancy at birth), education (mean years of schooling and expected years of schooling), and material living standards (gross national income (GNI) per capita). Despite the country’s significant and well-known challenges regarding infrastructure, safety and security, Trinidad and Tobago has been classed within the High category of the HDI’s rankings. As of 2019, the country was ranked 67th on the HDI, and its score of 0.796 (out of a maximum score of 1) left it just short of qualifying in the Very High development category. Within the Caribbean, only Barbados and the Bahamas (tied in 58th with scores of 0.814, classed in the Very High category) outscore T&T on the index. Table 1 summarises the country’s HDI data from 1990 onwards, and it can be observed that the main driver of improvement in the overall score is GNI per capita, while the health and education indicators increased moderately over the period.
Economic Structure
Observers of the T&T economy would know of its status as an energy commodity exporter. The evolution of the two key hydrocarbon products followed different paths however, as illustrated in Figure 2.
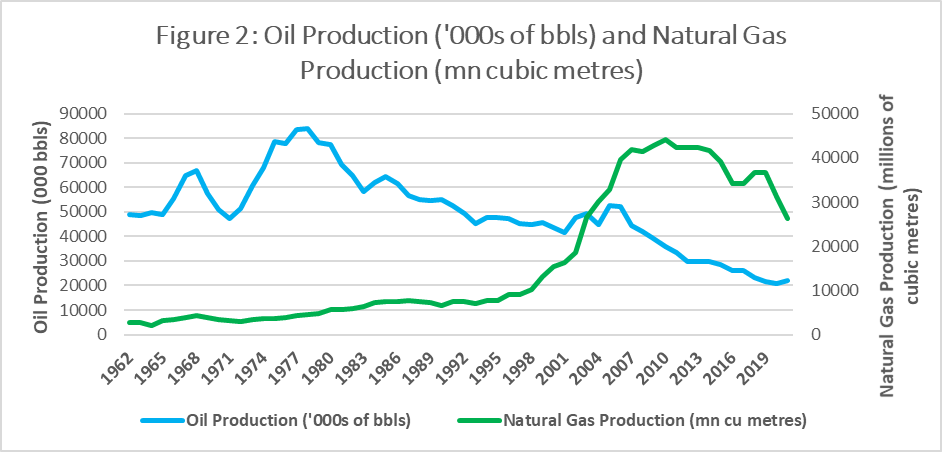
At Independence, oil production was at an already-significant 48.9 million barrels (133,900 barrels per day), and in fact peaked fairly early in 1978 at 83.8 million barrels (230,000 bpd), with a gradual decline to less than 22 million barrels (59,800 bpd) in 2021. Natural gas production, in contrast, started from a low base at Independence at 2.8 billion cubic metres in 1962. By 1980 output doubled to 5.6bn cubic metres, and by 1998 its growth had just about doubled again to 10.3bn cubic metres. After 1998 T&T’s gas output skyrocketed, more than quadrupling to a peak of 44bn cubic metres in 2011, before entering a phase of gradual decline similar to what the oil sector experienced after 1978.
Source: Central Bank of Trinidad and Tobago.
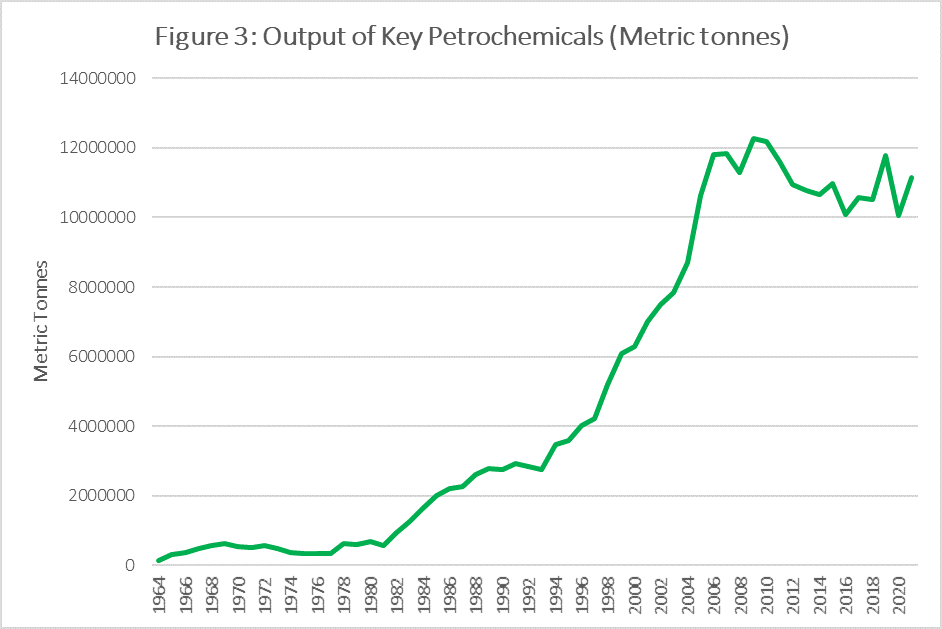
Apart from oil and natural gas, the third major energy-based industry to develop in T&T in the post-Independence period is the petrochemical industry (see Figure 3 above), driven by the establishment of the Point Lisas Industrial Estate since 1966 and its acceleration into the 1970s. The combined output of the country’s three key petrochemical products – ammonia, urea and methanol – rose from 135,600 metric tonnes in 1962 to a peak of 12.3Mn metric tonnes in 2009, before more volatile conditions took hold in the decade of the 2010s and production declined to 11.1Mn metric tonnes in 2021.
Despite a high and early degree of diversification within the energy sector – from oil to gas to petrochemicals – there has been limited diversification of the economy beyond the energy sector. Evidence of this can be adduced from two indicators of the country’s external economic performance – exports and foreign reserves.
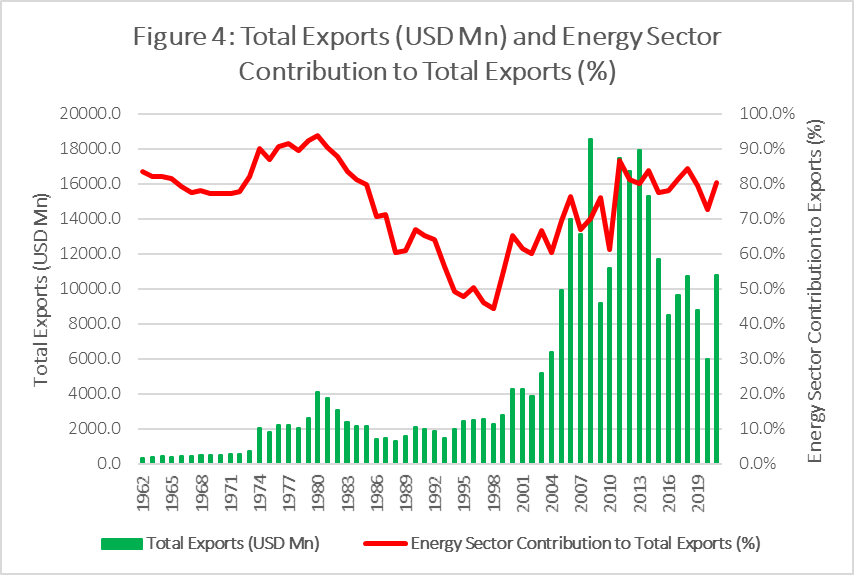
Figure 4 above shows that while there was a boom in exports in the 1973-1980 period, T&T truly became a more significant exporter in the 2000s, with volumes growing from USD5.2Bn in 2003 to a peak of USD18.5Bn in 2008, though this has come down significantly to USD10.8Bn in 2021, in keeping with lower energy sector production since that time. Moreover, the chart indicates that the country has remained hugely dependent on energy for its external receipts since 1962, with the only period of relative export diversification coming in the 1990s – with energy recording only 44% of total exports in 1998. Notably, during the 1990s the economy had been subject to significant liberalising reforms, including the abolition of exchange controls and floating of the TT dollar in 1993.
Mostly, however, oil and gas exports have dominated the T&T trade landscape, and have generally accounted for 70-80% of the total volume. Thus far, the country has not meaningfully addressed the so-called ‘Dutch disease’, whereby hydrocarbon exporters fail to diversify into other export products, as rising exports of those commodities strengthen the exchange rate and weaken the external competitiveness of the country’s non-energy industries.
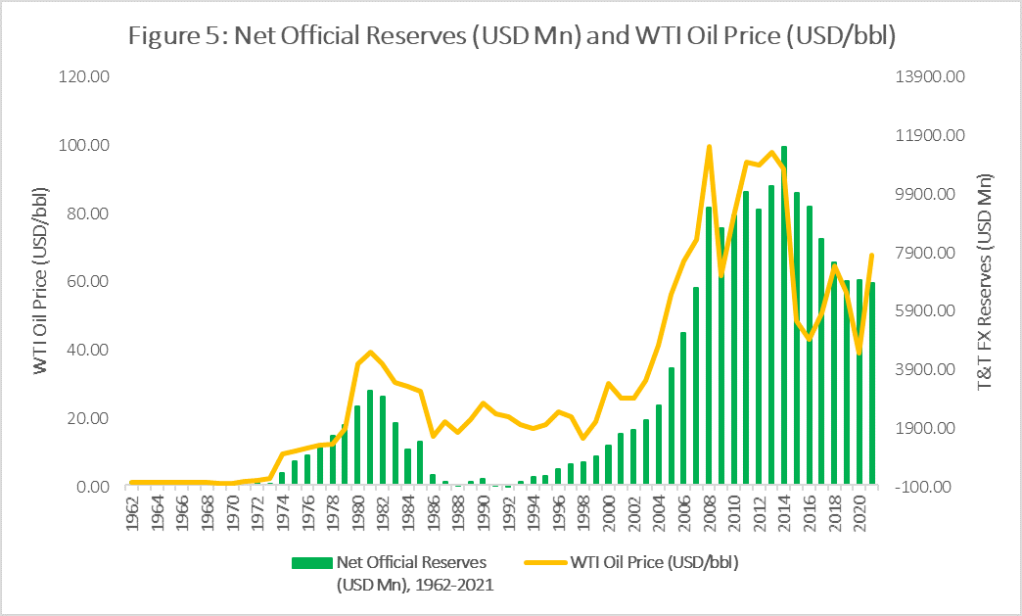
For a small open economy such as T&T, which is highly dependent on trade and also manages its own currency, foreign reserves are a crucial buffer against the vicissitudes of the global economy. Figure 5 illustrates that this country’s foreign reserves position has exhibited similar patterns to its other macroeconomic indicators, and has tracked extremely closely with the price of oil, indicating the key source of the build-ups in reserves over the two boom periods. Of particular interest is that net official reserves fell into negative territory during the oil price crash of the mid-1980s, leading to the IMF programme from 1986 onwards. After the 2014 peak in reserves at USD11.5Bn, they have been on a gradual decline though thus far the fall has not been as steep as in the 1980s.
Fiscal and Debt Dynamics
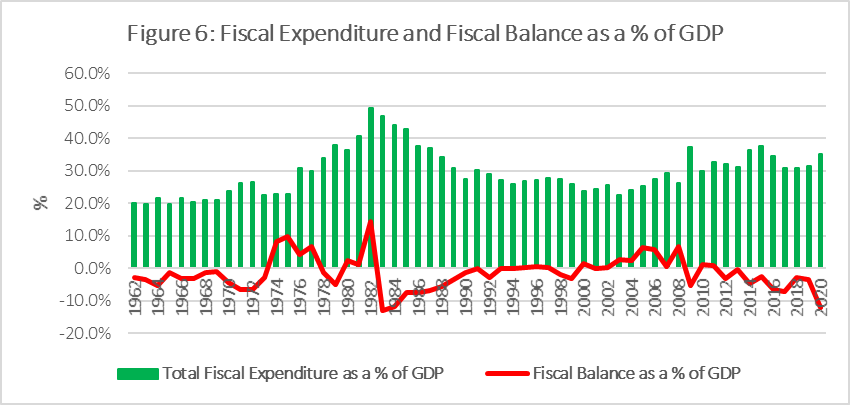
Finally, we will examine the fiscal position of T&T over the post-Independence period. Since 1962, the government has played a significant role in the economy, with total spending never dipping below 20% of GDP (see Figure 6). Government is also the largest employer in the country. Interestingly, although the absolute level of fiscal spending has trended upwards over the past few decades, with the country running deficits in every year since 2009, the ratio of spending to GDP was highest in 1982 at 49%. Even more surprisingly, the government ran a huge surplus of 14.5% of GDP in the same year, and the “oil boom” period was mostly characterised by surpluses in the fiscal accounts. In contrast, while the fiscal windfalls of the 2004-2014 period initially yielded consecutive years of surpluses, they were followed by a loosening of fiscal discipline and the persistence of deficit spending that continues until the present.
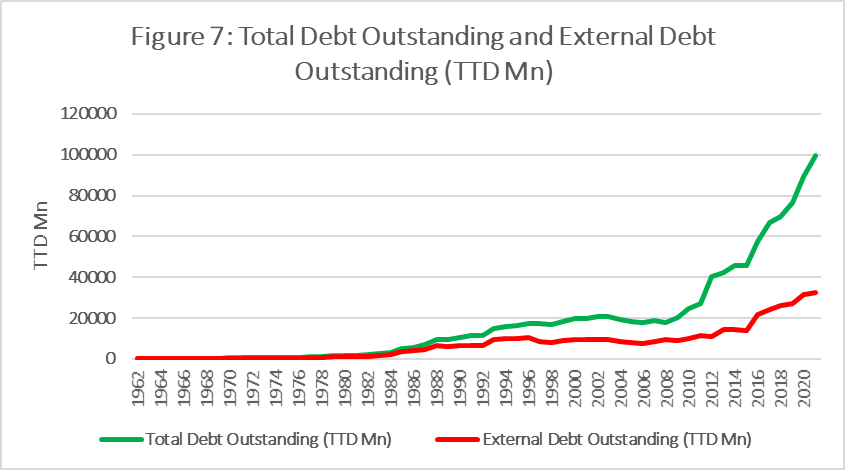
The dynamics of T&T’s fiscal expenditure over the years have also had a significant impact upon the country’s debt position. From Figure 7 above, it can be seen that T&T’s total debt has evolved in fairly distinct periods. Debt was fairly negligible until the end of the first oil boom, at which point the country’s finances significantly worsened and debt rose from TTD3.1Bn in 1984 to TTD10.5Bn in 1990. It took another twelve years for the debt level to double to TTD20.7Bn in 2002. In the first phase of the second energy boom, fiscal surpluses actually drove debt levels down to TTD17.7Bn in 2007, after which debt levels began to rise precipitously.
Between 2012 and 2013 total debt outstanding rose from 27.2Bn to 40.2Bn. The major slowdown in the economy after 2014, the difficulties in reining in spending due to the high level of transfers and subsidies, and the impact of the COVID-19 pandemic, meant that total debt more than doubled from 2014 to 2021, from TTD45.7Bn to TTD99.7Bn. The country’s total debt-to-GDP ratio has climbed significantly, from a low of 10.1% in 2008 to 62.3% in 2021. Since the 1980s, however, external debt has risen at a significantly slower pace than total debt, as the domestic banking sector has grown to take a far greater role in financing the government’s activities.
Conclusion
The data presented above shows that the T&T economy has undergone significant evolution over the 60 years since Independence, with rising incomes, the energy sector assuming primacy, exports and reserves strengthening, government maintaining a heavy hand in activity, and debt rising to a level of concern. Analysis of the data from the most recent IMF World Economic Outlook shows that there is only a 26% correlation between T&T’s GDP growth and global GDP growth, suggesting that there is a fairly limited relationship between the fortunes of this country’s economy and those of the wider globalised economy.
Indeed, the evidence suggests that the two boom periods in our post-Independence history have come at times of massive macroeconomic turmoil for the world. When hydrocarbon prices spiked in times of global trouble or excess – chiefly the OPEC crisis of 1973 and the commodities supercycle of 2004-2014, which bookended global financial crisis – the T&T economy temporarily boomed while most energy importers bore the brunt of increased costs and supply constraints. The present post-COVID supply shocks and the Russia-Ukraine induced commodity spike have followed a similar pattern, with countries around the world suffering from massively increased inflation, food shortages and economic hardship, while T&T so far has seen significant improvements in the fiscal balance due to the energy and petrochemical price spikes.
DISCLAIMER
First Citizens Bank Limited (hereinafter “the Bank”) has prepared this report which is provided for informational purposes only and without any obligation, whether contractual or otherwise. The content of the report is subject to change without any prior notice. All opinions and estimates in the report constitute the author’s own judgment as at the date of the report. All information contained in the report that has been obtained or arrived at from sources which the Bank believes to be reliable in good faith but the Bank disclaims any warranty, express or implied, as to the accuracy, timeliness, completeness of the information given or the assessments made in the report and opinions expressed in the report may change without notice. The Bank disclaims any and all warranties, express or implied, including without limitation warranties of satisfactory quality and fitness for a particular purpose with respect to the information contained in the report. This report does not constitute nor is it intended as a solicitation, an offer, a recommendation to buy, hold, or sell any securities, products, service, investment or a recommendation to participate in any particular trading scheme discussed herein. The securities discussed in this report may not be suitable to all investors, therefore Investors wishing to purchase any of the securities mentioned should consult an investment adviser. The information in this report is not intended, in part or in whole, as financial advice. The information in this report shall not be used as part of any prospectus, offering memorandum or other disclosure ascribable to any issuer of securities. The use of the information in this report for the purpose of or with the effect of incorporating any such information into any disclosure intended for any investor or potential investor is not authorized.
DISCLOSURE
We, First Citizens Bank Limited hereby state that (1) the views expressed in this Research report reflect our personal view about any or all of the subject securities or issuers referred to in this Research report, (2) we are a beneficial owner of securities of the issuer (3) no part of our compensation was, is or will be directly or indirectly related to the specific recommendations or views expressed in this Research report (4) we have acted as underwriter in the distribution of securities referred to in this Research report in the three years immediately preceding and (5) we do have a direct or indirect financial or other interest in the subject securities or issuers referred to in this Research report.