US Mid Terms and the Impact on the Market
Insights
The U.S. midterm election, as the name suggest, is held every four years midway through the presiding President’s term. This year, the date of the election is set for November 8th, 2022. Members of the U.S. population that are eligible to vote have a chance to elect their preferred members of Congress and representatives at the state and local levels. The results of this election will determine which political party will control Congress.
The U.S. Congress is split between the lower body, the House of Representatives (the House), and the upper body, the Senate. The House consists of 435 seats divided among the 50 states in proportion to their total population and the Senate consists of 100 seats with 2 senators for each state. As is customary, the party that secures the most seats, wins the election and by extension, has control of Congress. Presently, the Democratic Party hold a 221 to 212 majority in the House of Representative with two vacancies. In the Senate the Democrats hold 48 seats and the Republican hold 50 seats with 2 independent seats who both align with the Democrats.
In the upcoming midterm election, all 435 seats in the House s and 34 of the 100 seats in the Senate are up for re-election with the result determining which party, between the Democrats and Republicans would have control of Congress.
What’s at Stake?
The main implications for the financial market is policy related. Given the economic climate globally and specifically in the U.S., much emphasis and care is being placed on the legislative agenda and policies to navigate these challenging economic times.
Currently, the Democratic Party controls the House while the Senate is split 50-50 between the Democratic Party and the Republican Party. The equal division in the Senate means that the Democratic Party has a slim majority as voting which results in a tie, can be decided by the Vice President – Kamala Harris. The 50-50 split in the Senate makes it difficult to pass legislation even with the slim majority, as 60 out of the 100 votes are needed to pass a bill without contest; otherwise the opposing party can argue against the bill indefinitely, stalling the bill from moving forward.
Since President Biden has taken office in January 2021, the Democrats slim majority advantage in Congress has made it difficult to pass bills. This challenge was evident when two bills were signed at midnight on the deadline date, to avoid a government shutdown and keep the federal government running. Another example is the current unsuccessful bid to pass the Build Back Better bill which focuses on investments in the country’s infrastructure, green energy, child care and expansion of affordable healthcare. After a year and a half of negotiations the bill seems unlikely to be passed; at least before the midterm elections.
Notwithstanding, the Biden administration was successful at proposing and effecting into law key legislation including the Infrastructure Investment and Jobs Act, the Inflation Reduction Act and the American Rescue Plan Act. The ability to transform the economy, stimulate economic growth and deliver on strategic plans are dependent on the outcome of these elections.
Market Volatility
The midterm elections have direct implication for the economy and by extension the financial markets as the results would determine the leverage each political party will have on the success or failure of the President’s agenda. The party that controls the House would have a strong say on legislation regarding issues that are most concerning to the population and the economy and the proposed steps to be taken to address them.
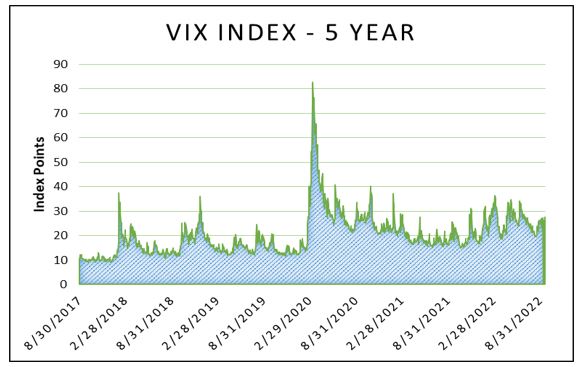
Usually, market volatility is higher in midterm election years, especially in the weeks leading up to election as anxiety builds up over the differing degrees of uncertainty and expectation. The period is usually underscored by increased volatility and falling returns on stock investments. The Chicago Board Options Exchange’s CBOE Volatility Index (VIX Index), which is the most popular measure of volatility in the stock market, is especially elevated immediately before and after the midterm elections. The higher the VIX Index the higher the market volatility and vice-versa.
So far this year, the VIX Index has generally been elevated above its historical average of 19.77 points (measured from 1990 to now) for most of 2022. In March 2022, the index reached a high of 35 points and currently sits at around 27 points. Volatility in 2022 has been led by the state of the economic recovery amidst decades high inflation and aggressive interest rate hikes to combat same. Clear evidence of pre-election volatility is yet to be observed in the market with investors focusing on the other moving parts that are currently taking centre stage.
Stock Market Impact
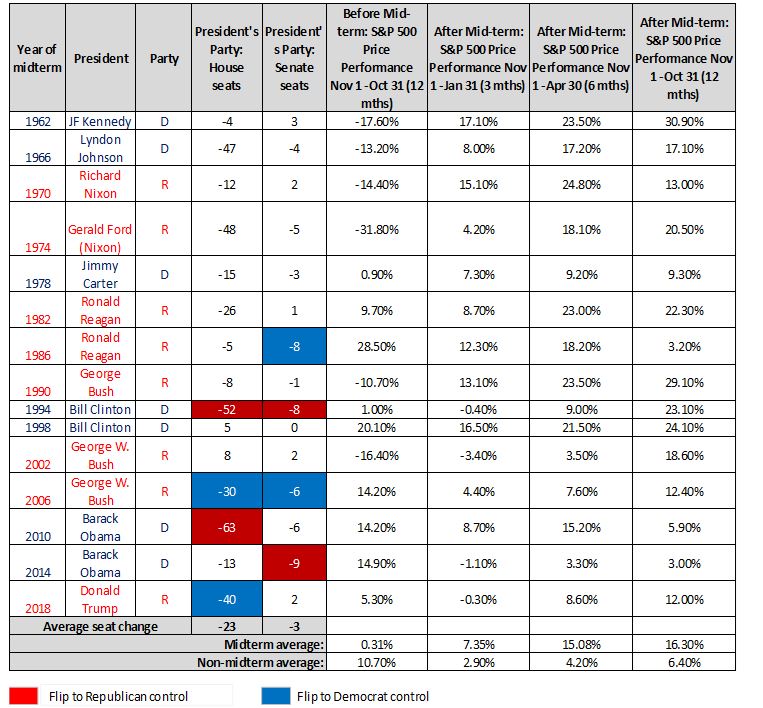
Historically, the S&P 500 performance in the 12 months leading up to the midterm election are usually low, with an average return of 0.31% since 1962. The momentum however changes after the elections, with returns averaging 16.30% over the same time period. Moreover, since 1962 the S&P 500 has never seen a negative return after 6 months or 12 months succeeding the midterm election.
Since 1962, the average annual return on the S&P 500 in the 12 months leading up to the elections is 0.3%, which is well below the historical average of 8.1% according to data sourced from Bloomberg. After midterm election the performance of the S&P 500 is usually much different. Historically, 12 months after the election, the S&P 500 returns an average of 16.3%.
U.S. Midterm Election Year Stock Market Performance Since 1962
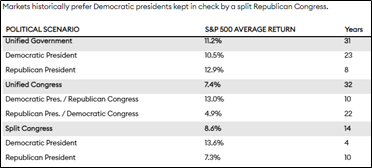
S&P 500 Returns under Various Political Scenarios
In examining the data during election periods, stock markets generally perform better under a Democratic presidency. From 1945 through the end of 2021, the compound annual growth rate for the S&P 500 measured 9.4% under Democratic presidents compared with 6.6% for Republican presidents.
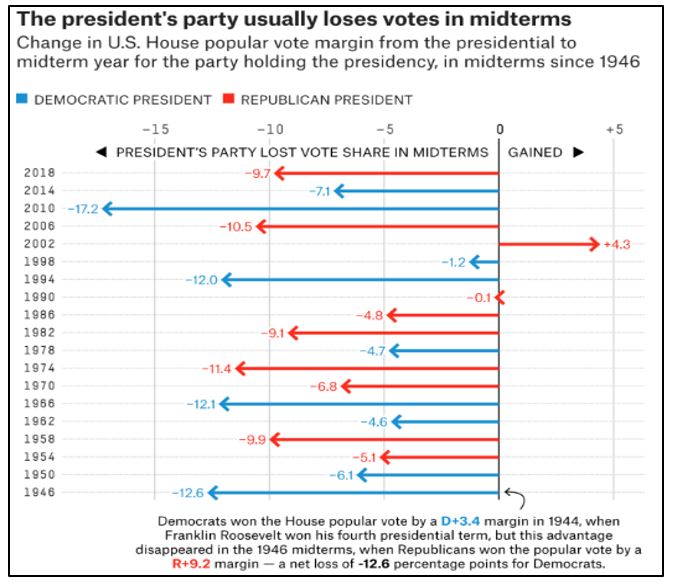
Past midterm election results have shown that the president’s party typically loses seats at this time. As seen in the table below, in the 19 midterm election since 1946, the president’s party has managed to improve their standing in only one midterm election. Also, since 1994, where it is argued that modern politics took hold, the president lost the popular vote in the House six times out of the seven midterm elections.
According to FiveThirtyEight’s presidential approval tracker, President Biden’s approval rating hit a low of 37.5% in July 2022 which shows an overall dissatisfaction with his presidency. Since then his approval rating has ticked up to 42.4% as at September 21, 2022. His rating increase came after the President was able to deliver on some campaign promises including signing into law the Inflation Reduction Act, a bipartisan gun-safety bill (the first major legislation on the issue in 28 years) and legislation geared towards making it easier for veterans to receive medical benefits.
The improvement in the prospects for the Democrats has seen prominent election forecasting models now give a 70% or better chance for them to retain their Senate majority. According to the forecast model from FiveThirtyEight, as at September 21, 2022, the Democrats would win a majority in 71 out of 100 simulations. According to the Economist’s forecasting, the Democrats would win a majority in 82 out of 100 simulations.
Possible Election Outcomes
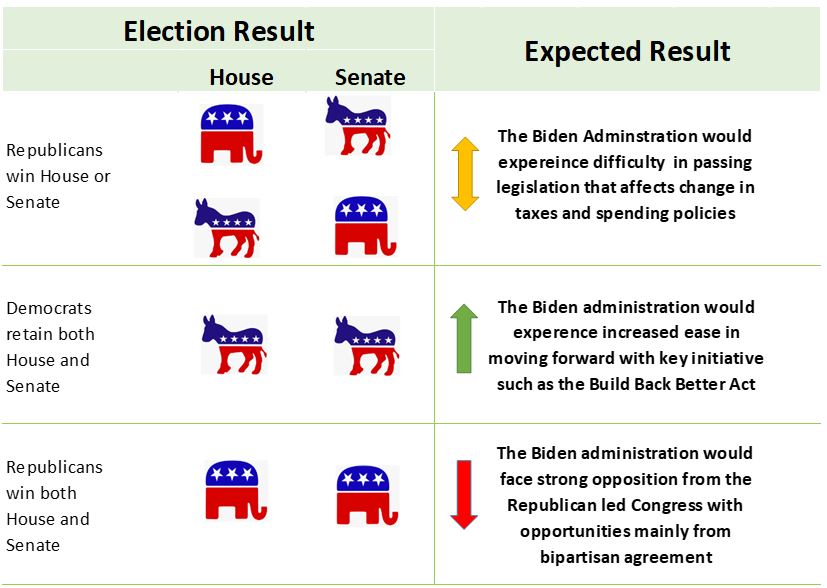
Scenario 1: Divided Government
Impact: The Biden administration would experience difficulty in getting major spending initiatives across the floor but this scenario could provide a little room for new legislation in areas where some consensus already exists between both parties. These areas include technology and crypto regulation, prescription drug pricing and energy investments.
Scenario 2: The Democrat Party retains the House and Senate.
Impact: This scenario will offer the smoothest path for the Biden administration to move forward with key initiatives and legislation, namely the Build Back Better Act which would likely be funded by increased corporate taxes and taxes on the wealthiest in the population. This scenario also increases the likelihood of the government following up on green initiatives, investments in infrastructure, tech regulation, affordable healthcare and internet for all.
Scenario 3: The Republican Party wins both the House and Senate.
Impact: This scenario would make any major spending or tax initiative unlikely with policies expected to be reactive rather than proactive. The Build Back Better agenda will be largely off the table.
Of these possible outcomes from the midterm elections, surprisingly, stock markets generally perform best with a Divided Government. When the government is divided, investors typically expect less major intervention from the government in the economy as policy gridlock is common in these situations. Less major government intervention in terms of taxation and spending would generally contribute to less volatility in the markets as stock prices fall on average following the announcement of policy changes according to the National Bureau of Economic Research (NBER).
Depending on the results of the election, investors can be comforted from the fact that historically markets improve in the 12-months following midterm elections. It should be noted however that historical trends do not necessarily mean that what has happened before will happen now. Considering the volatility and stock market performance in 2022, there is still wide uncertainty as to what will the stock market will look like regardless of how the elections turn out. Investors should carefully and cautiously position their portfolio to accommodate for the present realities.
DISCLAIMER
First Citizens Bank Limited (hereinafter “the Bank”) has prepared this report which is provided for informational purposes only and without any obligation, whether contractual or otherwise. The content of the report is subject to change without any prior notice. All opinions and estimates in the report constitute the author’s own judgment as at the date of the report. All information contained in the report that has been obtained or arrived at from sources which the Bank believes to be reliable in good faith but the Bank disclaims any warranty, express or implied, as to the accuracy, timeliness, completeness of the information given or the assessments made in the report and opinions expressed in the report may change without notice. The Bank disclaims any and all warranties, express or implied, including without limitation warranties of satisfactory quality and fitness for a particular purpose with respect to the information contained in the report. This report does not constitute nor is it intended as a solicitation, an offer, a recommendation to buy, hold, or sell any securities, products, service, investment or a recommendation to participate in any particular trading scheme discussed herein. The securities discussed in this report may not be suitable to all investors, therefore Investors wishing to purchase any of the securities mentioned should consult an investment adviser. The information in this report is not intended, in part or in whole, as financial advice. The information in this report shall not be used as part of any prospectus, offering memorandum or other disclosure ascribable to any issuer of securities. The use of the information in this report for the purpose of or with the effect of incorporating any such information into any disclosure intended for any investor or potential investor is not authorized.
DISCLOSURE
We, First Citizens Bank Limited hereby state that (1) the views expressed in this Research report reflect our personal view about any or all of the subject securities or issuers referred to in this Research report, (2) we are a beneficial owner of securities of the issuer (3) no part of our compensation was, is or will be directly or indirectly related to the specific recommendations or views expressed in this Research report (4) we have acted as underwriter in the distribution of securities referred to in this Research report in the three years immediately preceding and (5) we do have a direct or indirect financial or other interest in the subject securities or issuers referred to in this Research report.