Climate Change and Renewable Energy
Insights
Energy
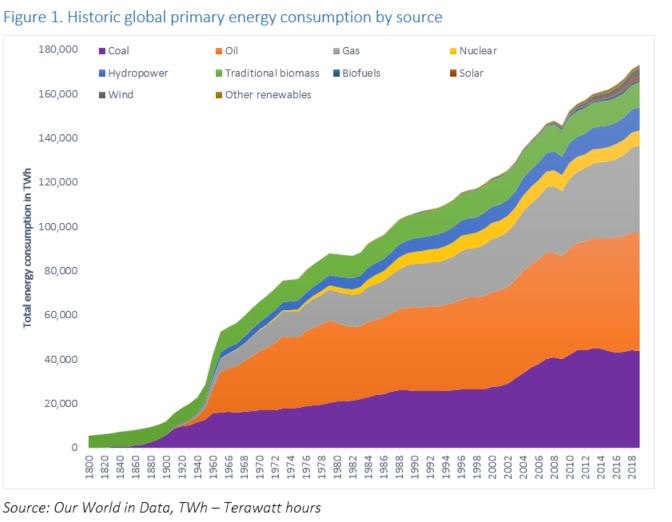
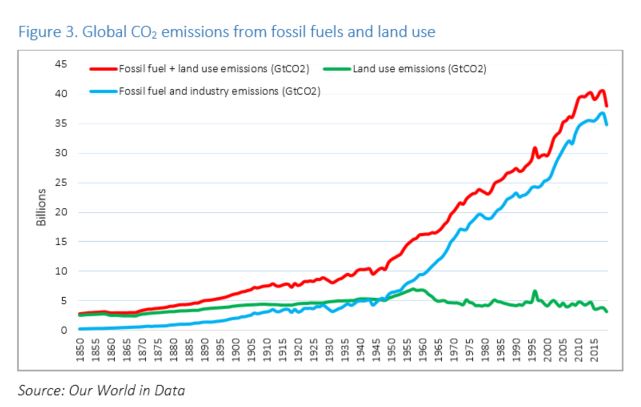
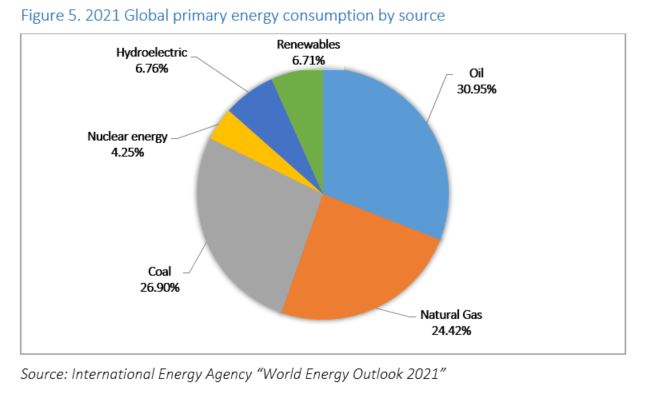
Historically, multiple advancements in technology in the industrial and manufacturing sectors led to increased production of various goods. The availability of every single good produced in the world increased tremendously over the past decades as the productive capacity of plants increased, leading to better variety and in some cases lower prices to the final consumers. Economies of scale aided in reducing final production costs and ultimately costs to consumers, however it came with a cost to the environment. As industrial and manufacturing plants grew in size to facilitate mass production, so did their energy consumption. In the mid-19th century, biomass (the burning of wood, crop waste or charcoal) was the dominant source of energy, in the industrial revolution the use of coal for energy production was introduced followed by oil and gas. During the 20th century, hydropower was introduced with nuclear energy being introduced in the late 1960s followed by renewables such as solar and wind in the 1980s. According to OurWorldInData in 2020, roughly 38.02Bn tonnes of CO2 were emitted globally from fossil fuels and land use, with fossil fuels emissions accounting for 91.5% of total emissions. Emissions from land use accounted for roughly 8.5% of total emissions in 2020 and stems from the natural degradation of forests as well as the burning of biomass, which include forest fires and other forms of agricultural burning. The growing need to reduce global emissions means that nations must now shift their respective energy production mixes away from fossil fuels to low-carbon sources. In 2021, roughly 82% of global energy originated from fossil fuels such as oil (31%), coal (27%) and natural gas (24%) but only 18% came from low-carbon sources such as nuclear (4%) and renewables (14%).
Over the years, several global pacts signed by various countries devoted to reducing the impact of climate change have lessened the reliance on fossil fuels as the main energy source in the production mix. This facilitated the advancement of technology in the production of energy through renewables and nuclear allowing for many countries to reduce their fossil fuel usage. Several countries now have an energy mix with more than 50% stemming from low-carbon sources (low-carbon is defined as the sum of nuclear and renewable sources where renewable sources include hydropower, solar, wind, geothermal, wave and tidal as well as bioenergy) such as Iceland (79%), Sweden (69%) and Norway (66%). Low-carbon sources account for less than 1% of the sources used to generate energy in oil-producing nations such as Saudi Arabia, Oman and Kuwait.
Climate Change
Industrialisation, consumption and manufacturing are the main causes of the gradual increase in the global average temperature of the past two centuries. Most notably, since 1975 global temperatures consistently increased on average each year. Human emissions of carbon dioxide (CO2) and other greenhouse gases over the years are the main drivers of climate change and has contributed substantially to the occurrence of extreme weather events such as floods, droughts, storms and heatwaves. Annually, snow cover and sea ice in the northern hemisphere and colder parts of the world continue to decline as the globe continue to heat up resulting in increased rainfall and more intense heatwaves that lead to drought and changing habitats for plants and animals.
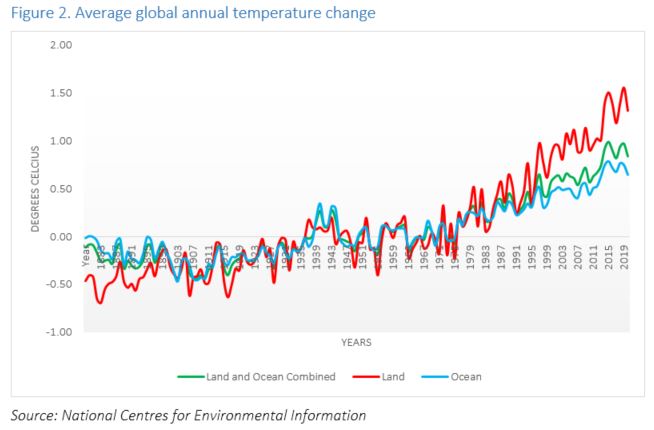
Based on records at the National Centres for Environmental Information (NCEI), the years 2013-2021 were the warmest and 2021 market the 45th consecutive year with global temperatures above the 20th century average. Past trends in energy consumption and production led to the sustained rise in both CO2 emissions and global temperatures. However, plans to reduce the average annual rise will result in a major shift in the energy consumption and production mix. Since 1974, global average temperatures rose consecutively each year in both land and ocean classifications. The shift away from fossil fuels such as oil, gas and coal to cleaner energy sources such as solar, wind, nuclear, biofuels and geothermal will result in the gradual reduction in CO2 emissions and thus slow the pace of global warming. Although global warming is a phenomenon that cannot be prevented, there are many options available to humankind to reduce the growing rates of global warming. Reducing global warming is vital to mitigating the rising sea levels due to the melting of glaciers, ice sheets and polar caps. Since 1880, the global mean sea level rose roughly 8-9 inches with roughly three of those inches rising in the last 25 years alone. Persistently rising sea levels is a major concern to tourism-dependent nations such as those in the Caribbean that attract a majority of their tourists due to their beautiful shores and moderate temperatures. Rising sea levels pose a significant threat to these tourist destinations. To address the severe impending situations envisioned by the current energy usage and emissions patterns several international agreements on climate change were adopted over the years.
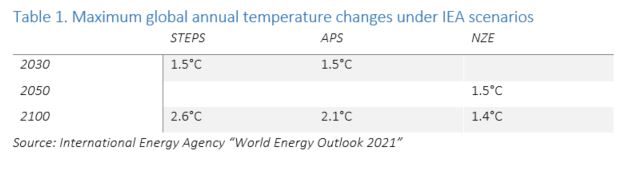
In the International Energy Agency’s (IEA) world energy outlook (WEO), three scenarios were presented concerning the outlook for climate change based on polices set by governments.
- Stated Policies Scenario (STEPS) – this scenario reflects little to no change on specific policies currently in place by governments around the world.
- Announced Pledges Scenario (APS) – this scenario assumes that all commitments to climate change made by governments as well as Nationally Determined Contributions (NDCs) and longer-term net zero targets will be met in full and on time.
- Net Zero Emissions by 2050 Scenario (NZE) – under this scenario the global energy sector will achieve net zero CO2 emissions by 2050.
In the STEPS scenario, the IEA predicts a rapid rebound in global energy-related and industrial processes that result in a sustained rise in CO2 emissions to 30 gigatonnes (Gt) in 2030, 34Gt under the NZE scenario emissions should fall to 21Gt in the same time period. The sustained rise in energy consumption necessitates a more rapid shift away from fossil fuel use to cleaner energy sources such as nuclear and renewables like solar, wind and geothermal. The table below highlights the maximum global change in temperatures based on the scenarios described above in the IEA’s WEO.
International Agreements on Climate Change
Kyoto Protocol
The Kyoto Protocol was implemented in 1997 and entered into force in 2005 as the first legally binding treaty on climate. This treaty seeks to make developed countries reduce emissions by an average of 5% below 1990 levels and establish a system to monitor the progress of countries. Unfortunately, minimal actions were made by these nations to reduce their emissions and developing nations such as China and India continued to contribute significantly to the global rise in CO2 emissions. The United States was one such nation that entered the agreement but subsequently withdrew its membership.
Paris Agreement
In 2015, the Paris Agreement was established with the requirement for all countries to set emissions-reduction pledges. This legally binding international treaty on climate change was adopted by 196 parties on 12 December 2015 and entered into force on 4 November 2016. Governments of these nations set targets known as Nationally Determined Contributions (NDCs) with the collective goal of limiting global warming to below 2 °C (annual average global temperature rise). NDCs also contain the list of actions to be undertaken by countries to reduce their respective greenhouse gas emissions. One of the more prevalent goals is to reach global net-zero emissions by the second half of the century or from 2050. Achieving global net-zero emissions means the amount of greenhouse gases emitted must equal the amount removed from the atmosphere.
The Glasgow Climate Pact
The Glasgow Climate Pact, the most recent climate change pact to be adopted at the COP26 held in 2021 builds upon the two aforementioned climate change pacts/treaties. The meeting ended with each country agreeing to work together to limit global warming to below 2 °C and aim for a 1.5 °C increase at most. 153 countries updated their respective NDCs which contain their emissions targets for 2030. The United Nations (UN) projects these new NDCs to lower greenhouse gas emissions by around 5 billion tonnes by 2030. Four key themes were put forward in COP26;
- Mitigation – steps and commitments that participating countries will take to accelerate the efforts to reduce emissions.
- This involves the need for countries to accelerate the phasing out of coal in their energy production and consumption mixes; reduce deforestation; ramp up the switch to electric vehicles.
- Adaptation, loss and damage – participants agreed to launch a 2-year Glasgow-Sharm el Sheikh Work Programme that aims to reduce vulnerability, strengthen resilience and increase the capacity of people and the planet to adapt to the impacts of climate change.
- This includes countries increasing their ability to protect and restore ecosystems; and build defences, warning systems and infrastructure to protect homes, livelihoods and lives.
- Finance – developed nations and public finance institutions will continue contributing to the USD100Bn climate finance goal, which is projected to be achieved by 2023. Developed nations committed to boost their support to the Least Developed Countries Fund.
- The UN has noted the need to mobilise at least USD100Bn in funding annually going forward to achieve the goals set under mitigation and adaptation.
- Collaboration – collaboration between governments and businesses will be ramped up to promote more rapid adoption of climate goals.
- This will be done through the finalisation of the Paris Rulebook which details rules to ensure the Paris Agreement is operational; increased transference of data, knowledge and skills necessary to tackle climate change.
Current Energy Trends
Over the past decade, global energy consumption grew by around 1.4% on average each year through 2011-2022 despite a contraction in energy consumption of around 3.9% in 2020 due to the pandemic. As populations continue to grow in size along with household incomes, the demand for energy continues to rise and so too the amount of global CO2 emissions. In wealthier nations across the globe, energy consumption patterns are significantly higher than poorer nations, in some cases persons in nations such as Norway and the United States consume on average 100 times more energy than persons in some of the poorest nations. Following the pandemic which led to a decline in energy demand, it rebounded by more than 5.5% in 2021 and is projected to continue increasing due to rapid growth rates in economies across the globe. Unfortunately, the war in Ukraine resulted in a significant increase in energy prices. In the quarter ended June 2021, WTI and Brent Crude oil traded at USD66.1 and USD68.6 per barrel respectively, but shot up to USD114.6 and USD120.1 per barrel respectively due to the war. The uptick in prices was due to stronger demand growth than supply growth and heavy sanctions placed on Russia that deterred many nations from trading with them.
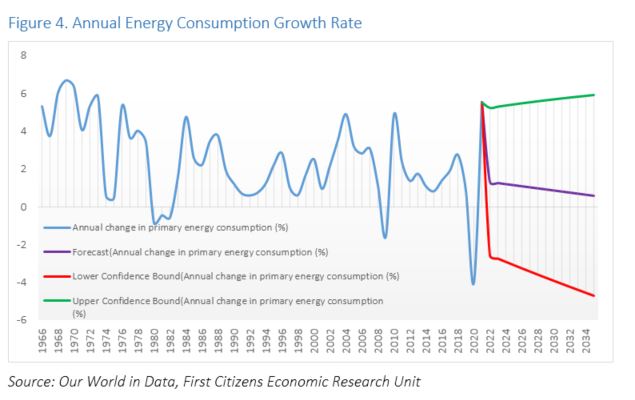
Energy demand trends to 2030 show an annual growth in demand of 1.3% and 1.0% under the STEPS and APS scenarios respectively from 2020-2030. The NZE scenario envisioned by the IEA predicts an annual average decline in energy demand of 0.7% by 2030.
Renewables
In 2022, the unprecedented ongoing “special operation” in Ukraine resulted in a sharp rise in energy commodity prices and the actions undertaken by nations across the globe to prevent Russia from escalating its actions did little to lower prices. Across Europe the leaders of the European Union (EU) announced their intention to cut out the imports of Russian fossil fuels by 2027 raising the need for the EU to adopt renewables for their energy generation. In France the government signalled its intention to restart several nuclear energy plants and continue progress on other nuclear projects given their tremendous energy generation yield over renewables such as solar and wind. The United Kingdom (UK) similarly increased their attention on several nuclear energy projects as they sought to rapidly diversify their energy generation to cut out imports of energy from Russia.
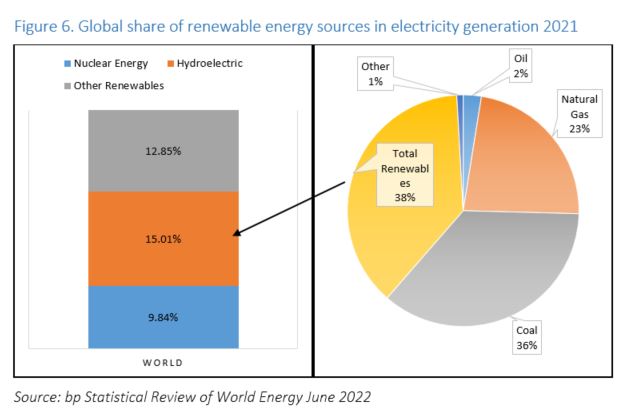
In 2021, energy generation from renewable sources such as solar, wind, geothermal and biomass increased by 16.5% from 2020 worth roughly 3,657.2 terawatt-hours or 6.71% of the world’s total energy generation. The generation of energy from hydroelectricity declined by 1.4% in 2021 year-on-year but still contributed 4,273.8 terawatt-hours or a little above 6.76% of the world’s total energy generation. The generation of energy from nuclear grew by 4.2% year-on-year in 2021 with total generation of 2,800.3 terawatt-hours or 4.25% of global energy generation. Over time, the increasing need to shift energy generation and electricity production away from fossil fuels to renewables and clean energy sources will result in lower CO2 emissions.
Trinidad and Tobago
In 2015, the government set a target to generate electricity from renewable sources such as solar and wind at 10% by the year 2021 in an effort to curb CO2 emissions. At the time of announcement, it was noted Trinidad and Tobago (TT) used approximately 150GW of power annually and would need its renewables projects to generate at least 150MW of power to meet the target. In 2016, TT signed the Paris Agreement committing to reducing emissions by 15% relative to a business as usual baseline by 2030 (roughly equivalent to 103Mn tonnes of CO2e) from the power generation, transport and industrial sectors. Additionally, the government aims to reduce emissions in the public transportation sector by 30% by 2030. Unfortunately, despite various pledges and announcements to commit to diversifying the energy consumption mix through renewable sources, data for 2021 shows that more than 99% of TT’s energy consumption is driven by fossil fuels. Particularly less than 0.005% of TT’s total electricity generation is driven by renewable or clean energy sources. Although there has been little progress on the switch to renewable or clean energy sources for electricity generation, substantial progress has been made on energy conservation measures.
The estimated costs to meet the targets set out in TT’s NDC amounts to USD2Bn over the period 2017-2030 and will be funded through domestic and international sources not limited to localised taxes and international financial agencies. Several challenges to achieving the targets of the NDC include:
- Information – there is limited high quality quantitative information available for TT on areas such as emissions and cost estimations for each activity highlighted in the NDC.
- Capacity – TT faces capacity constraints to implement the NDC not limited to domestic expertise and infrastructure.
- Financial – Like other non-advanced nations, TT needs more financial resources for the implementation of its identified mitigation activities.
To overcome these challenges several recommendations were presented to TT by the Partnership on Transparency in the Paris Agreement. These include enhancing TT’s data collection organisations, enhance coordination amongst key stakeholders to boost capacity and increase the funding through conducting a broader analysis of the global financial industry.
Conclusion
Modernisation over the years led to vast improvements in the quality of life, technology and various aspects of transportation and telecommunications. Increases in energy generation and consumption since the 1800s resulted in substantial increases in global emissions that have directly contributed to global warming over the years and the reduction in surface and sea ice across the globe. To mitigate the effects of climate change, several international agreements were adopted by nations around the world that intend to diversify energy consumption toward renewable and clean energy sources. The gradual adoption rate of renewable and clean energy sources in the coming years will help speed up the mitigation of global warming and foster numerous market opportunities. In TT, the investments in climate change policies will promote the eventual diversification of energy generation toward renewables and clean energy sources.
DISCLAIMER
First Citizens Bank Limited (hereinafter “the Bank”) has prepared this report which is provided for informational purposes only and without any obligation, whether contractual or otherwise. The content of the report is subject to change without any prior notice. All opinions and estimates in the report constitute the author’s own judgment as at the date of the report. All information contained in the report that has been obtained or arrived at from sources which the Bank believes to be reliable in good faith but the Bank disclaims any warranty, express or implied, as to the accuracy, timeliness, completeness of the information given or the assessments made in the report and opinions expressed in the report may change without notice. The Bank disclaims any and all warranties, express or implied, including without limitation warranties of satisfactory quality and fitness for a particular purpose with respect to the information contained in the report. This report does not constitute nor is it intended as a solicitation, an offer, a recommendation to buy, hold, or sell any securities, products, service, investment or a recommendation to participate in any particular trading scheme discussed herein. The securities discussed in this report may not be suitable to all investors, therefore Investors wishing to purchase any of the securities mentioned should consult an investment adviser. The information in this report is not intended, in part or in whole, as financial advice. The information in this report shall not be used as part of any prospectus, offering memorandum or other disclosure ascribable to any issuer of securities. The use of the information in this report for the purpose of or with the effect of incorporating any such information into any disclosure intended for any investor or potential investor is not authorized.
DISCLOSURE
We, First Citizens Bank Limited hereby state that (1) the views expressed in this Research report reflect our personal view about any or all of the subject securities or issuers referred to in this Research report, (2) we are a beneficial owner of securities of the issuer (3) no part of our compensation was, is or will be directly or indirectly related to the specific recommendations or views expressed in this Research report (4) we have not acted as underwriter in the distribution of securities referred to in this Research report in the three years immediately preceding and (5) we do have a direct or indirect financial or other interest in the subject securities or issuers referred to in this Research report.